2021 Austrian GP: FP2 race simulation pace


- Like
- Digg
- Del
- Tumblr
- VKontakte
- Buffer
- Love This
- Odnoklassniki
- Meneame
- Blogger
- Amazon
- Yahoo Mail
- Gmail
- AOL
- Newsvine
- HackerNews
- Evernote
- MySpace
- Mail.ru
- Viadeo
- Line
- Comments
- Yummly
- SMS
- Viber
- Telegram
- Subscribe
- Skype
- Facebook Messenger
- Kakao
- LiveJournal
- Yammer
- Edgar
- Fintel
- Mix
- Instapaper
- Copy Link
Click on the image to view the “image” in high resolution. Since it is a vector, not a rasterized image, you can zoom in as much as you want. To get the hi-res png images click here, here and here.
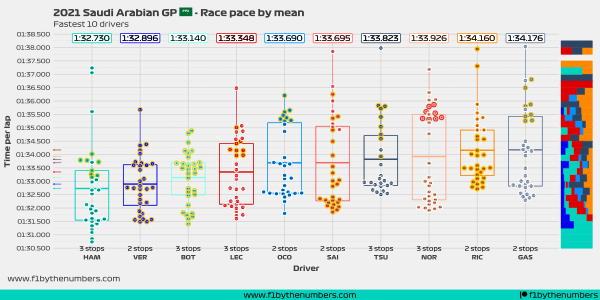
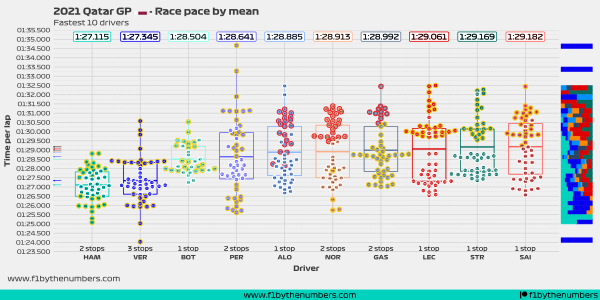
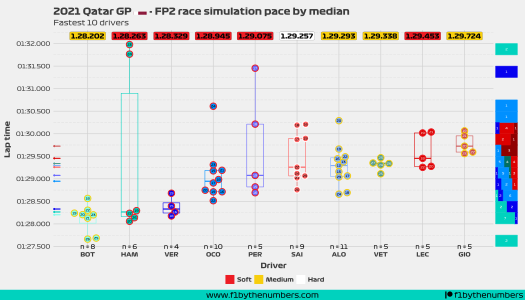
The numbers inside the dots represent the lap in which that particular time was done. Drivers who did their laps later in the session will tend to have faster times. Keep that in mind when comparing the lap times done by different drivers.
The box represents a traditional box plot, with the line in the middle representing the median time done by each driver. The top and bottom lines respectively represent the 75% percentile and the 25% percentile.
The arrows represent the median time done by each driver. With this new addition, you can visually compare the median time among the drivers.
The histogram on the right side of the plot is binning the lap times in intervals of 0.25 seconds. This histogram is on a 100% scale, meaning that each bin is independent of the others.
If you do not see a driver in the plot, it is because he did not do a race simulation stint during the practice session.
If you see fewer laps than the number displayed above the driver’s name, then it is because the lap was slower than the maximum time represented in this chart.
Interactive FP2 chart
As an addition to this blog, I have created this interactive chart which will allow you to see how the FP2 session developed. It is better viewed on a big screen such as a computer monitor or tablet, but it should work for mobile too.
In this chart, the point sizes are representative of the lap times done by each driver. Bigger points represent slower laps, while smaller points represent faster laps. The square-shaped points are regular laps, while the circular-shaped dots represent laps in which a driver pitted. The outline of the dots is colored depending on the tire used in that particular lap (red = soft, yellow = medium and hard = white). The x-axis represents the session time as per the F1 live timing app. I know that the session is technically 1 hour but the app assumes the session starts approximately one hour earlier than the actual start.
You can hover over the points shown on the chart to see more information about the selected lap. If you want a hi-res image, just click here.
FP2 general overview


Do you have a chart that shows a driver’s fastest sector times in practice 1-3 to come up with a theoretical fastest lap by that driver?
Hello John
I do have the data and I used to do charts like that for my quali session overview. I used to include information such as fastest sector times, fastest speeds, and theoretical “perfect” laps which basically combined the best sectors from each driver. I only used FP2 since that’s the practice in which drivers are pushing.
I have created some new analyses so I stopped doing that due to a lack of time and energy. I think some people didn’t like that perfect lap either. They said that it made no sense combining all three sectors from different laps. I somewhat agree with them but I thought it was still a fun visualization just to show more or less what you can expect from each driver in quali.