

2019 French GP: Tricky circuit for Ferrari?


- Like
- Digg
- Del
- Tumblr
- VKontakte
- Buffer
- Love This
- Odnoklassniki
- Meneame
- Blogger
- Amazon
- Yahoo Mail
- Gmail
- AOL
- Newsvine
- HackerNews
- Evernote
- MySpace
- Mail.ru
- Viadeo
- Line
- Comments
- Yummly
- SMS
- Viber
- Telegram
- Subscribe
- Skype
- Facebook Messenger
- Kakao
- LiveJournal
- Yammer
- Edgar
- Fintel
- Mix
- Instapaper
- Copy Link
“Paul Ricard was a tricky circuit for us last year and we know this kind of track isn’t particularly favourable for our package,”
Principal Component Analysis (PCA) of F1 tracks
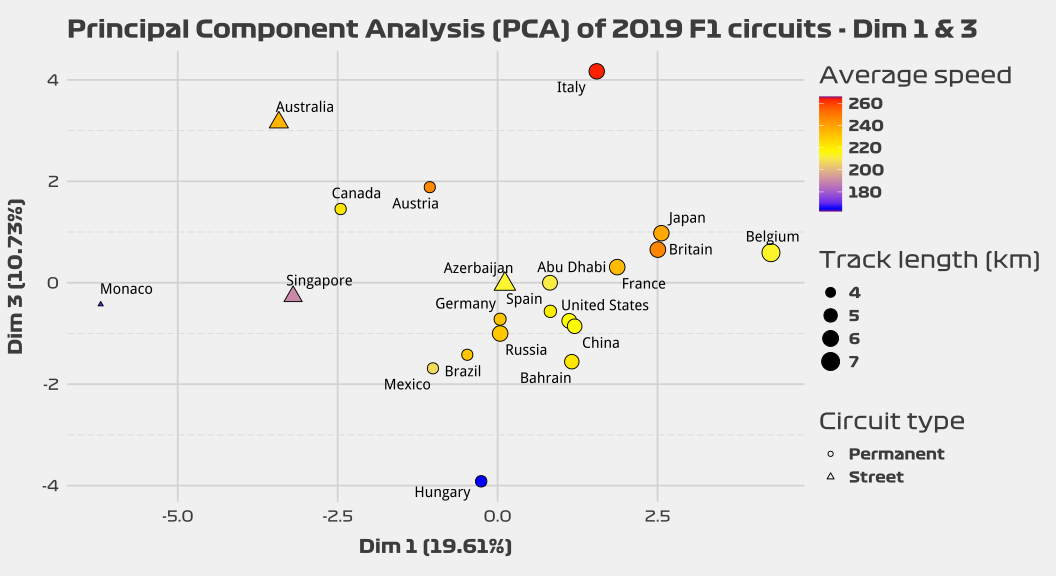
This will not be a lesson on statistics. Let’s get straight to the point. A PCA plot allows us to get many variables reduced to “dimensions”. In other words, PCA capture the essence of the data in a few principal components. If we have 10, 20, 30 or any number of variables, we can try to plot them in a couple of dimensions, and see how our data is shown in our euclidean space.
For this analysis, I added many characteristics of all tracks of the calendar, including track length, number of corners, aerodynamic requirements, and many others, and decided to map them in the plots shown above. As you can see, we get clustering depending on all the track characteristics. The PCA reduces all the variables, and plots them in 2 dimensions based on their similarities. Dots that are closer to each other, are similar, while dots that are separated from each other, are not very alike. However, depending on which dimensions we use, we get different results.
In the plot below, we see that using only the first 2 dimensions is not enough. Dimension 1 and 2, in total, account only for 35.57% of the variance, meaning that we may be losing a lot of information by trying to plot our data in only a 2D plane. So what if we could plot our data in a 10D plane for example, and then calculate the distances between all tracks? Tracks closer together would be more similar, while tracks farther apart would be more dissimilar. Well, suprise surprise, it turns out that we can.

Euclidean distances in n-dimensional space

I may have exaggerated a little bit. While we can not plot our data in a 10-dimension plot (we can only see up to 3 dimensions at once!), we can actually calculate the distances between our data points in a 10-dimensional plot. This may not make a lot of sense, but the mathematics in this case allow us to do things that are very abstract for our human minds.
Let’s take the Circuit Paul Ricard, and compare it to the rest of the tracks of the calendar. Tracks that have less “distance”, shown in green tones, are more similar to the French track, and tracks with more distance, shown in red tones, are less similar.
In this instance, we see that according to our analysis, the French GP is similar to the Circuit of the Americas, the Circuit de Barcelona-Catalunya, and the Shanghai International Circuit. On the other hand, we see that the Circuit Paul Ricard is very different from the Circuit de Monaco, the Red-Bull Ring, and the Marina Bay Street Circuit.
Analysis
The French GP is the 6th fastest track of the calendar, but is one that favours a car that excels in the corners instead of straights. The Paul Ricard Circuit is a track with high tire stress. This does not mean that it is a track with high degradation, but that it is a circuit where a car with strong aerodynamic and chassis foundations will tend to maintain traction, and therefore gain time, in the technical corners. Talking about the corners, while the circuit does not have many of them, it has a variety of low, medium and high speed ones.
If our analysis is giving us meaningful information, what can we expect from the French GP? Well, then we may expect Mercedes to do a good job in France. Ferrari had a bad time in Spain, and while their race in China was not as bad as in Spain, Mercedes still looked a step ahead of the Scuderia.
It will be interesting to see what Red Bull can do in France with their new power unit upgrade. Red Bull always develops cars that tend to do well in tracks with sudden changes of direction, but lacks in straight line speed. If their new power unit is significant, we may be able to see them challenging the Scuderia.
Final remarks
Our PCA analysis shows us that the Circuit Paul Ricard is more similar to tracks like Spain and China, tracks that tend to favour Mercedes, than to tracks like Bahrain or Canada, tracks where Ferrari has shown good pace.
This analysis is not perfect, and it depends on the data fed to the database, but it is a good way to see which tracks are more similar, or dissimilar, to each other.
The French GP is very challenging for drivers, with technical corners that require maximal concentration. Expect Lewis Hamilton to battle Valtteri Bottas for pole, with Red Bull being a team who may be able to challenge the Scuderia if their power unit upgrade is significant.
I hope that you have enjoyed this article, let me know what you think in the comments below.
- Like
- Digg
- Del
- Tumblr
- VKontakte
- Buffer
- Love This
- Odnoklassniki
- Meneame
- Blogger
- Amazon
- Yahoo Mail
- Gmail
- AOL
- Newsvine
- HackerNews
- Evernote
- MySpace
- Mail.ru
- Viadeo
- Line
- Comments
- Yummly
- SMS
- Viber
- Telegram
- Subscribe
- Skype
- Facebook Messenger
- Kakao
- LiveJournal
- Yammer
- Edgar
- Fintel
- Mix
- Instapaper
- Copy Link
0 Comments