2021 Spanish GP: Race pace


- Like
- Digg
- Del
- Tumblr
- VKontakte
- Buffer
- Love This
- Odnoklassniki
- Meneame
- Blogger
- Amazon
- Yahoo Mail
- Gmail
- AOL
- Newsvine
- HackerNews
- Evernote
- MySpace
- Mail.ru
- Viadeo
- Line
- Comments
- Yummly
- SMS
- Viber
- Telegram
- Subscribe
- Skype
- Facebook Messenger
- Kakao
- LiveJournal
- Yammer
- Edgar
- Fintel
- Mix
- Instapaper
- Copy Link
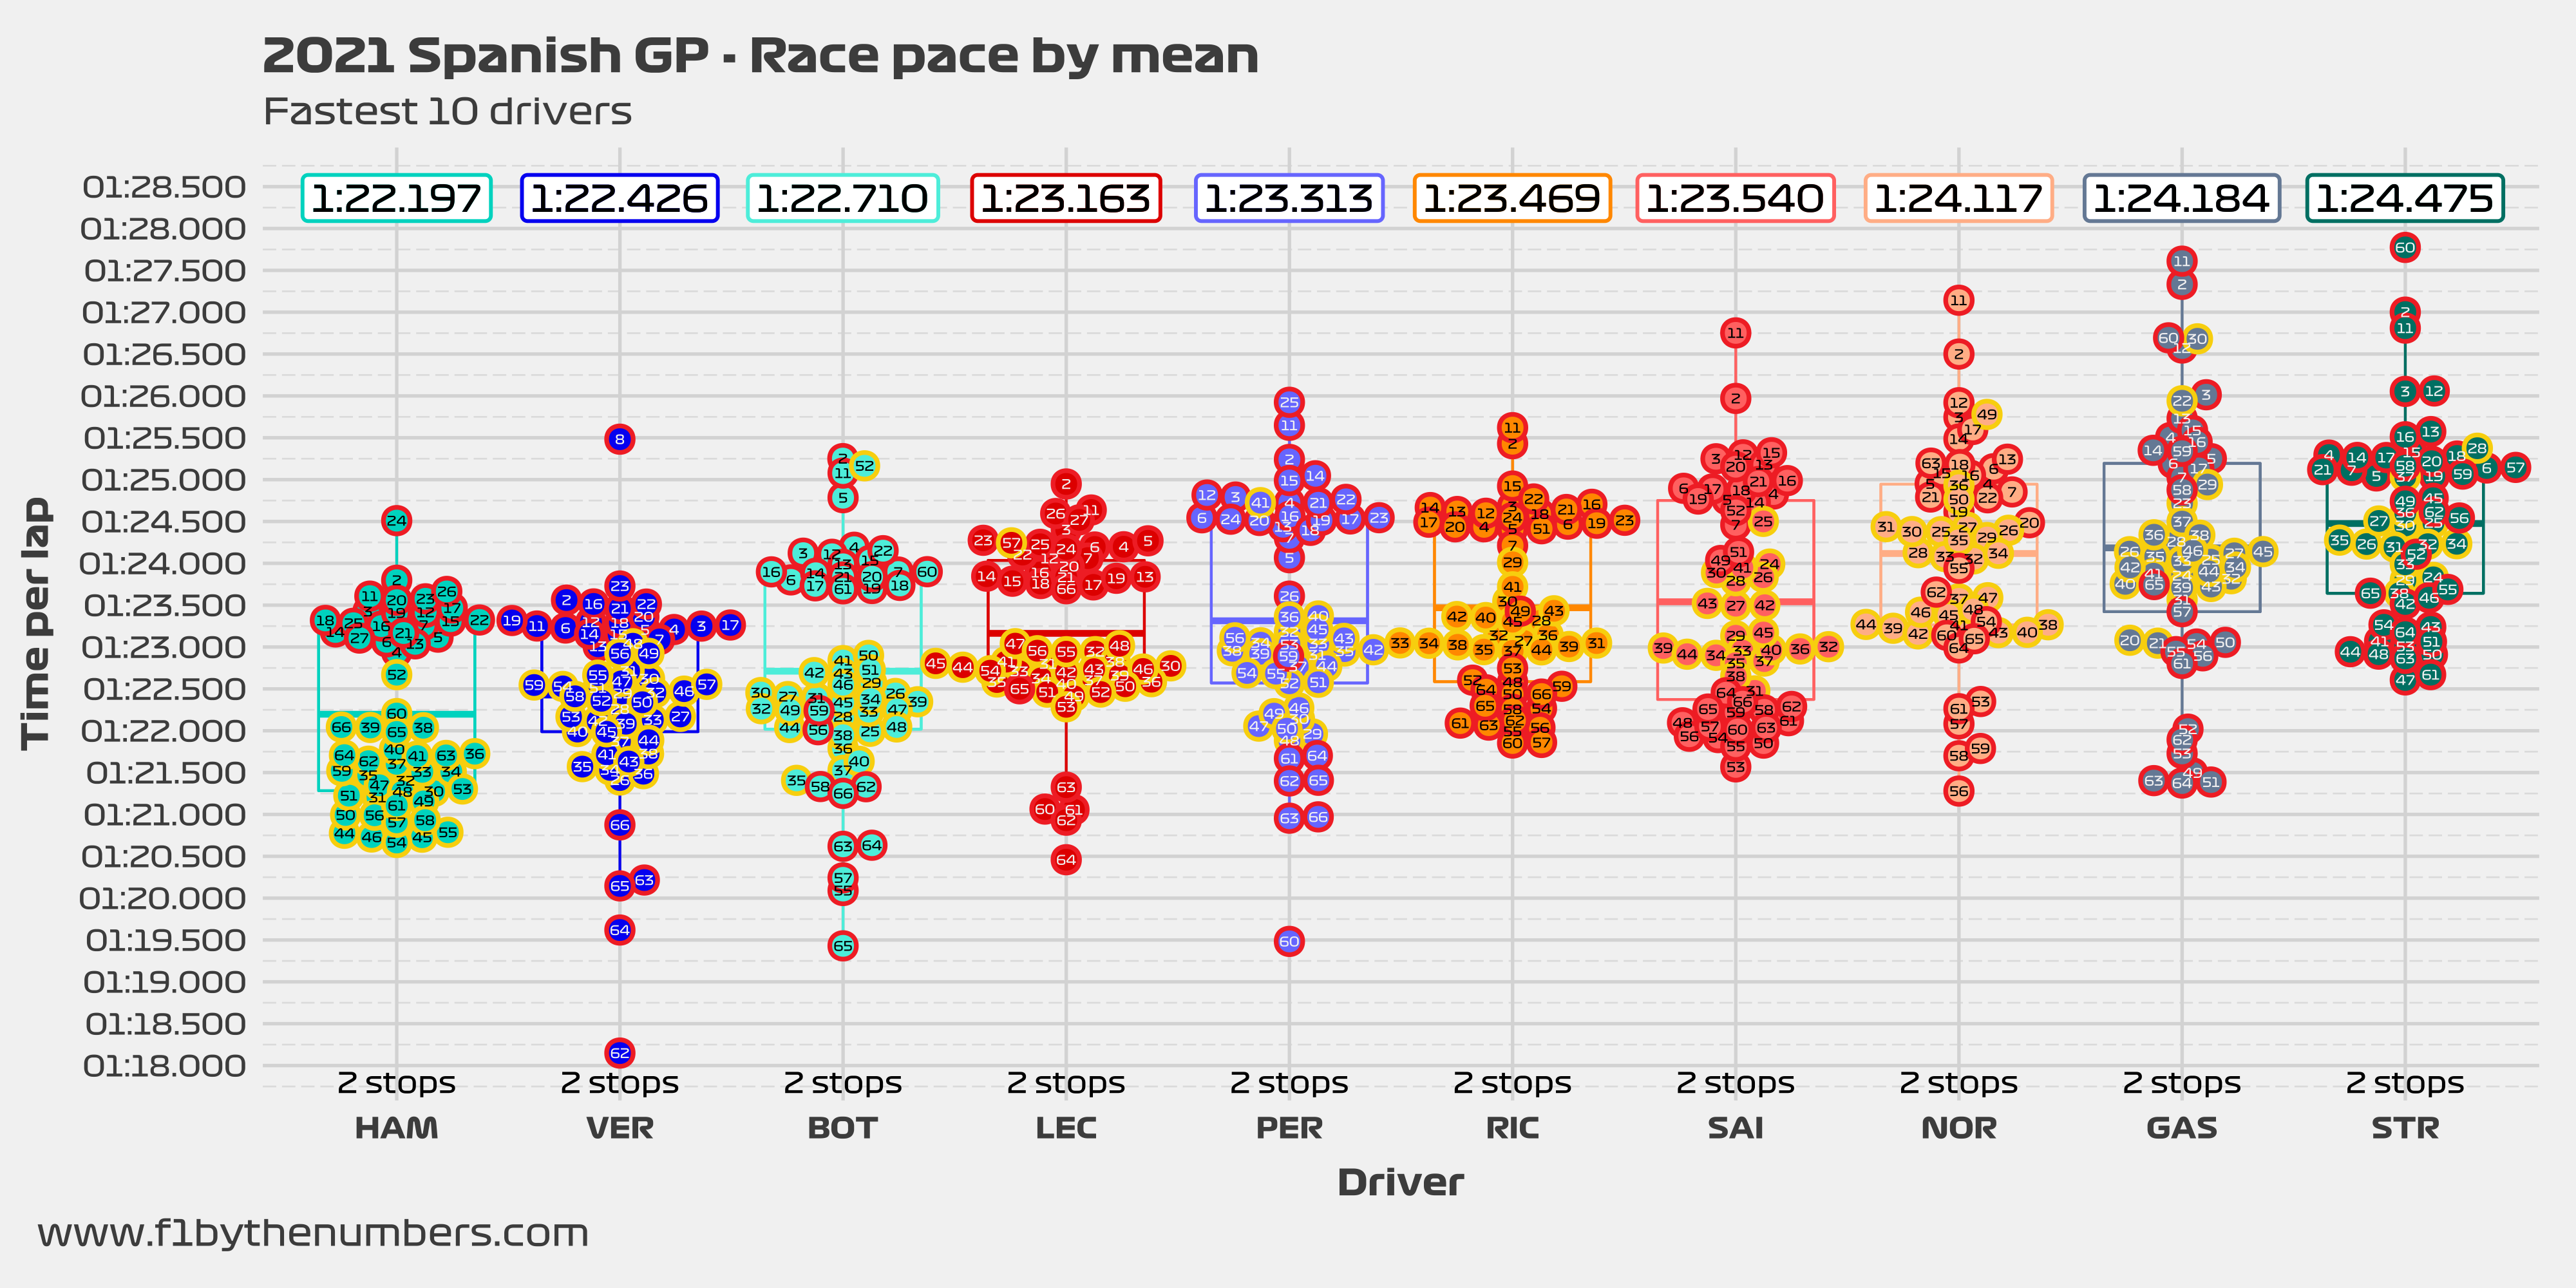
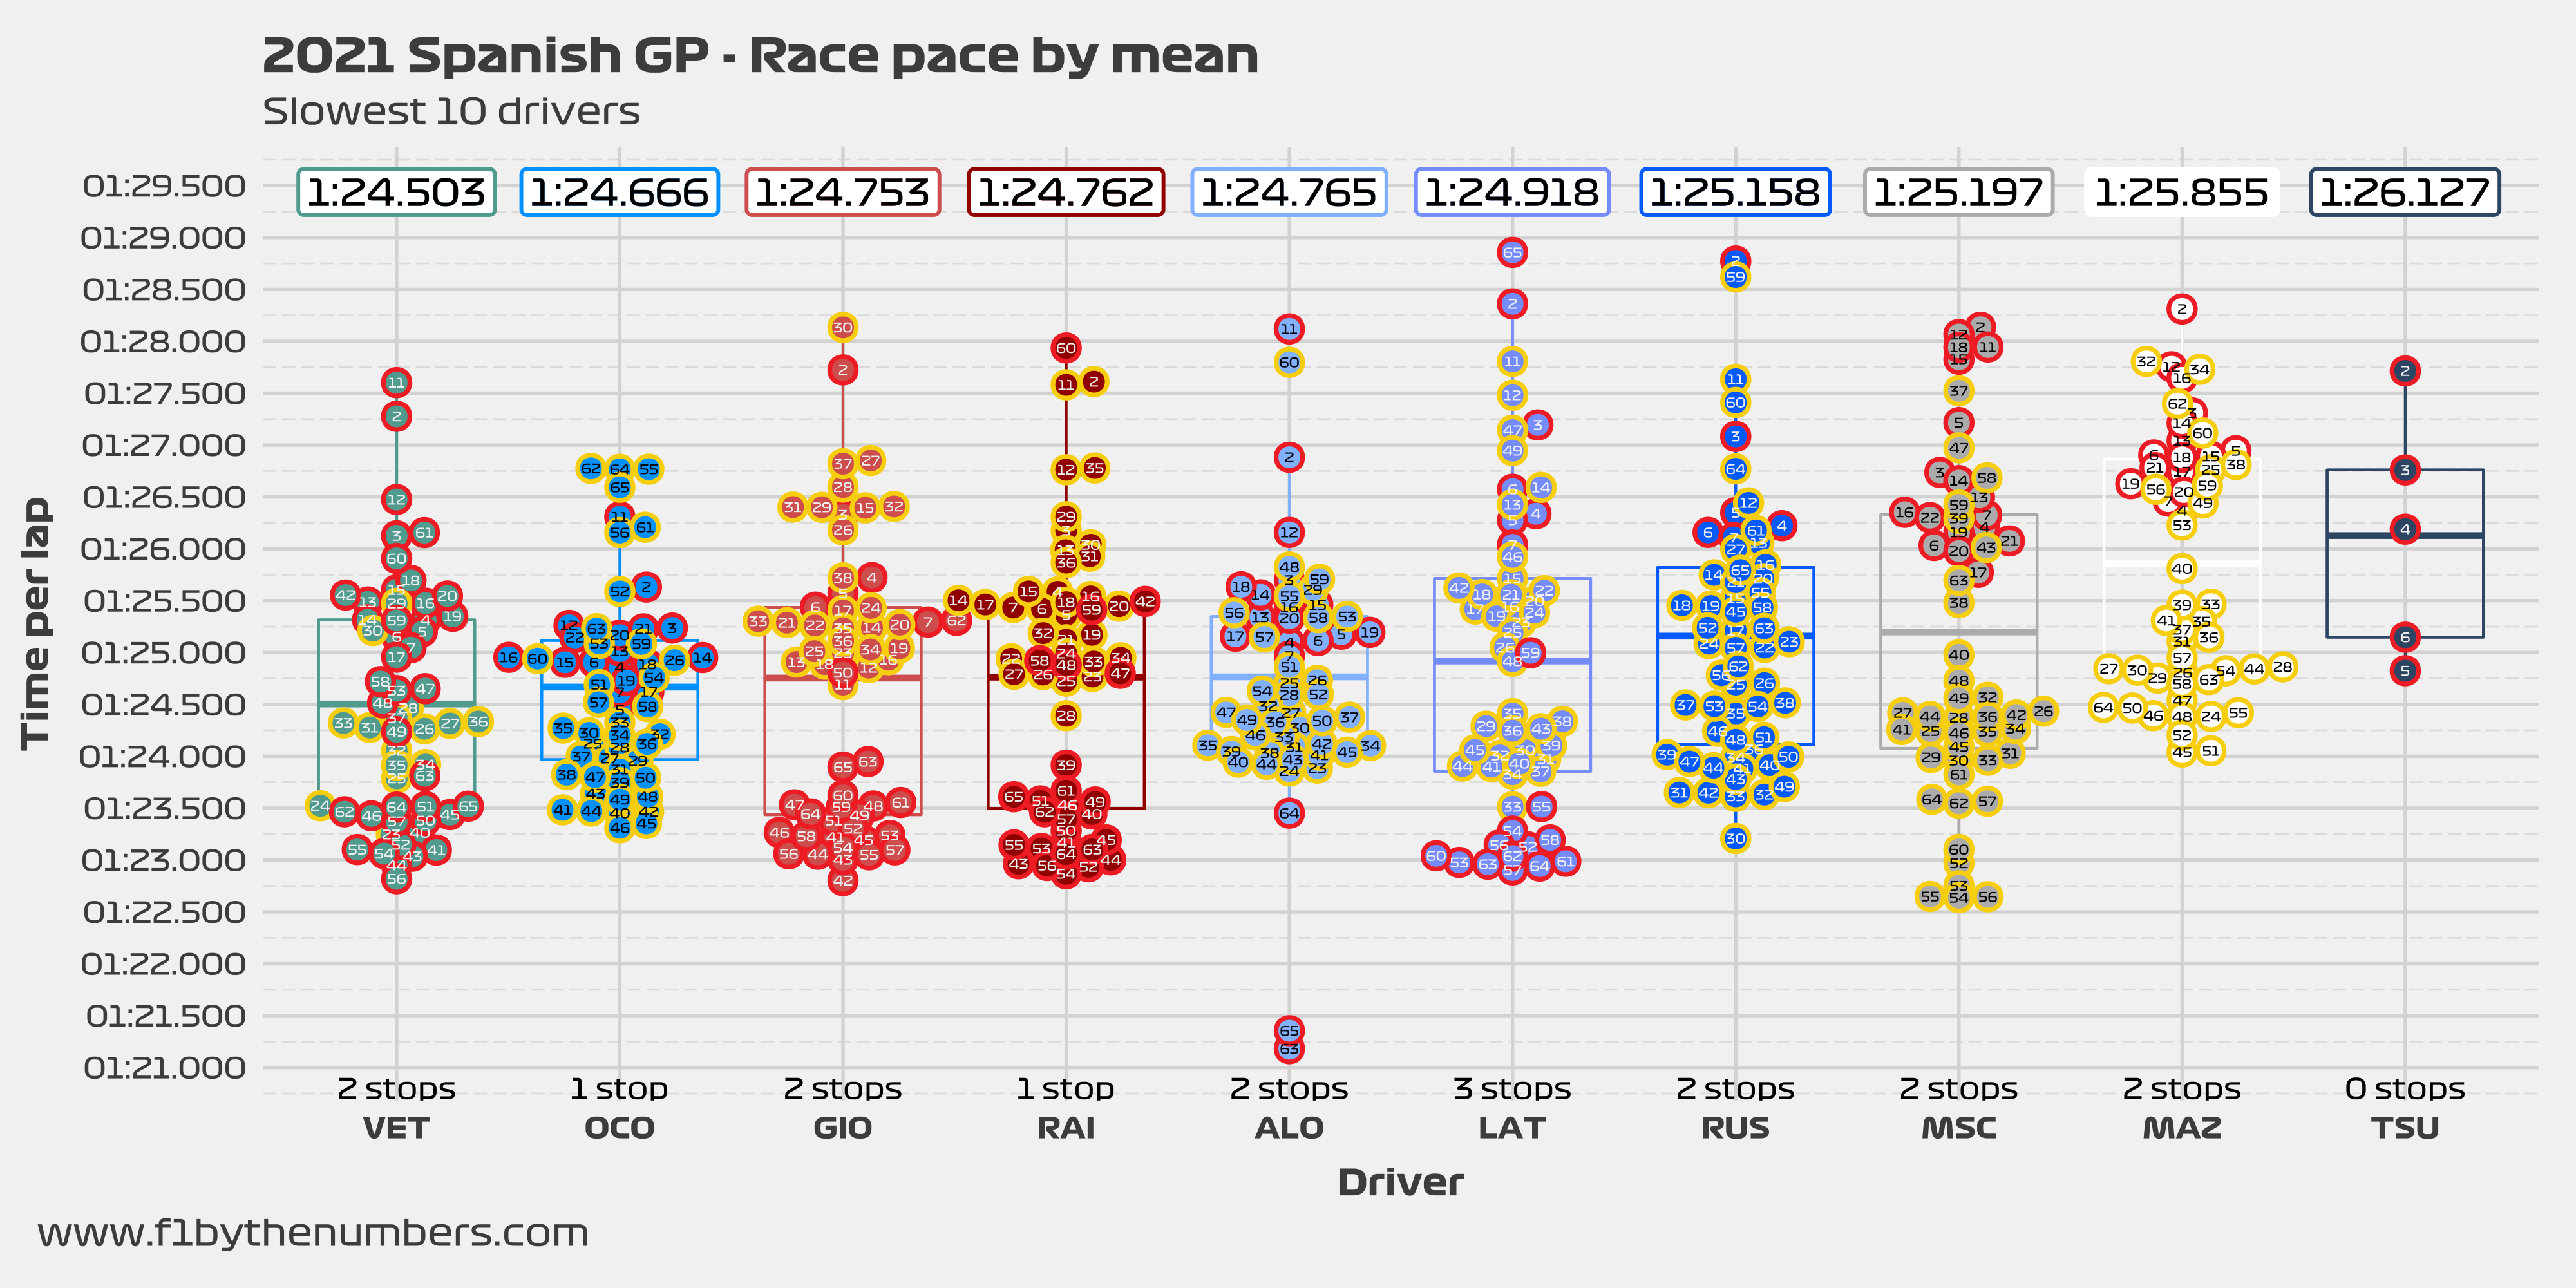
The images shown above are vectors. You can zoom in on them as much as you want to see in which lap was each individual time done. To get the png file for the fastest drivers, click here. To get the png file for the slowest drivers, click here. For the image that includes all the drivers click here.
The main idea of this chart is to show the representative average race pace of each driver. Since plotting the raw data will not show accurate information, I have to do a bit of data pre-processing.
To remove the outliers, I use an IQR method. This means that the race pace analysis removes laps that are considered to be anomalous. This includes the first lap, laps done when the safety car was out and incomplete laps (laps when the driver went in or out of the pits).
If laps were done with the intermediate or wet tires, then they were considered for this analysis.
The box represents a modified box plot, with the line in the middle representing the mean (average) time done by each driver. The top and bottom line respectively represent the 75% percentile and the 25% percentile.
Remember that drivers with more pit stops tend to have faster times than drivers with fewer pit stops.
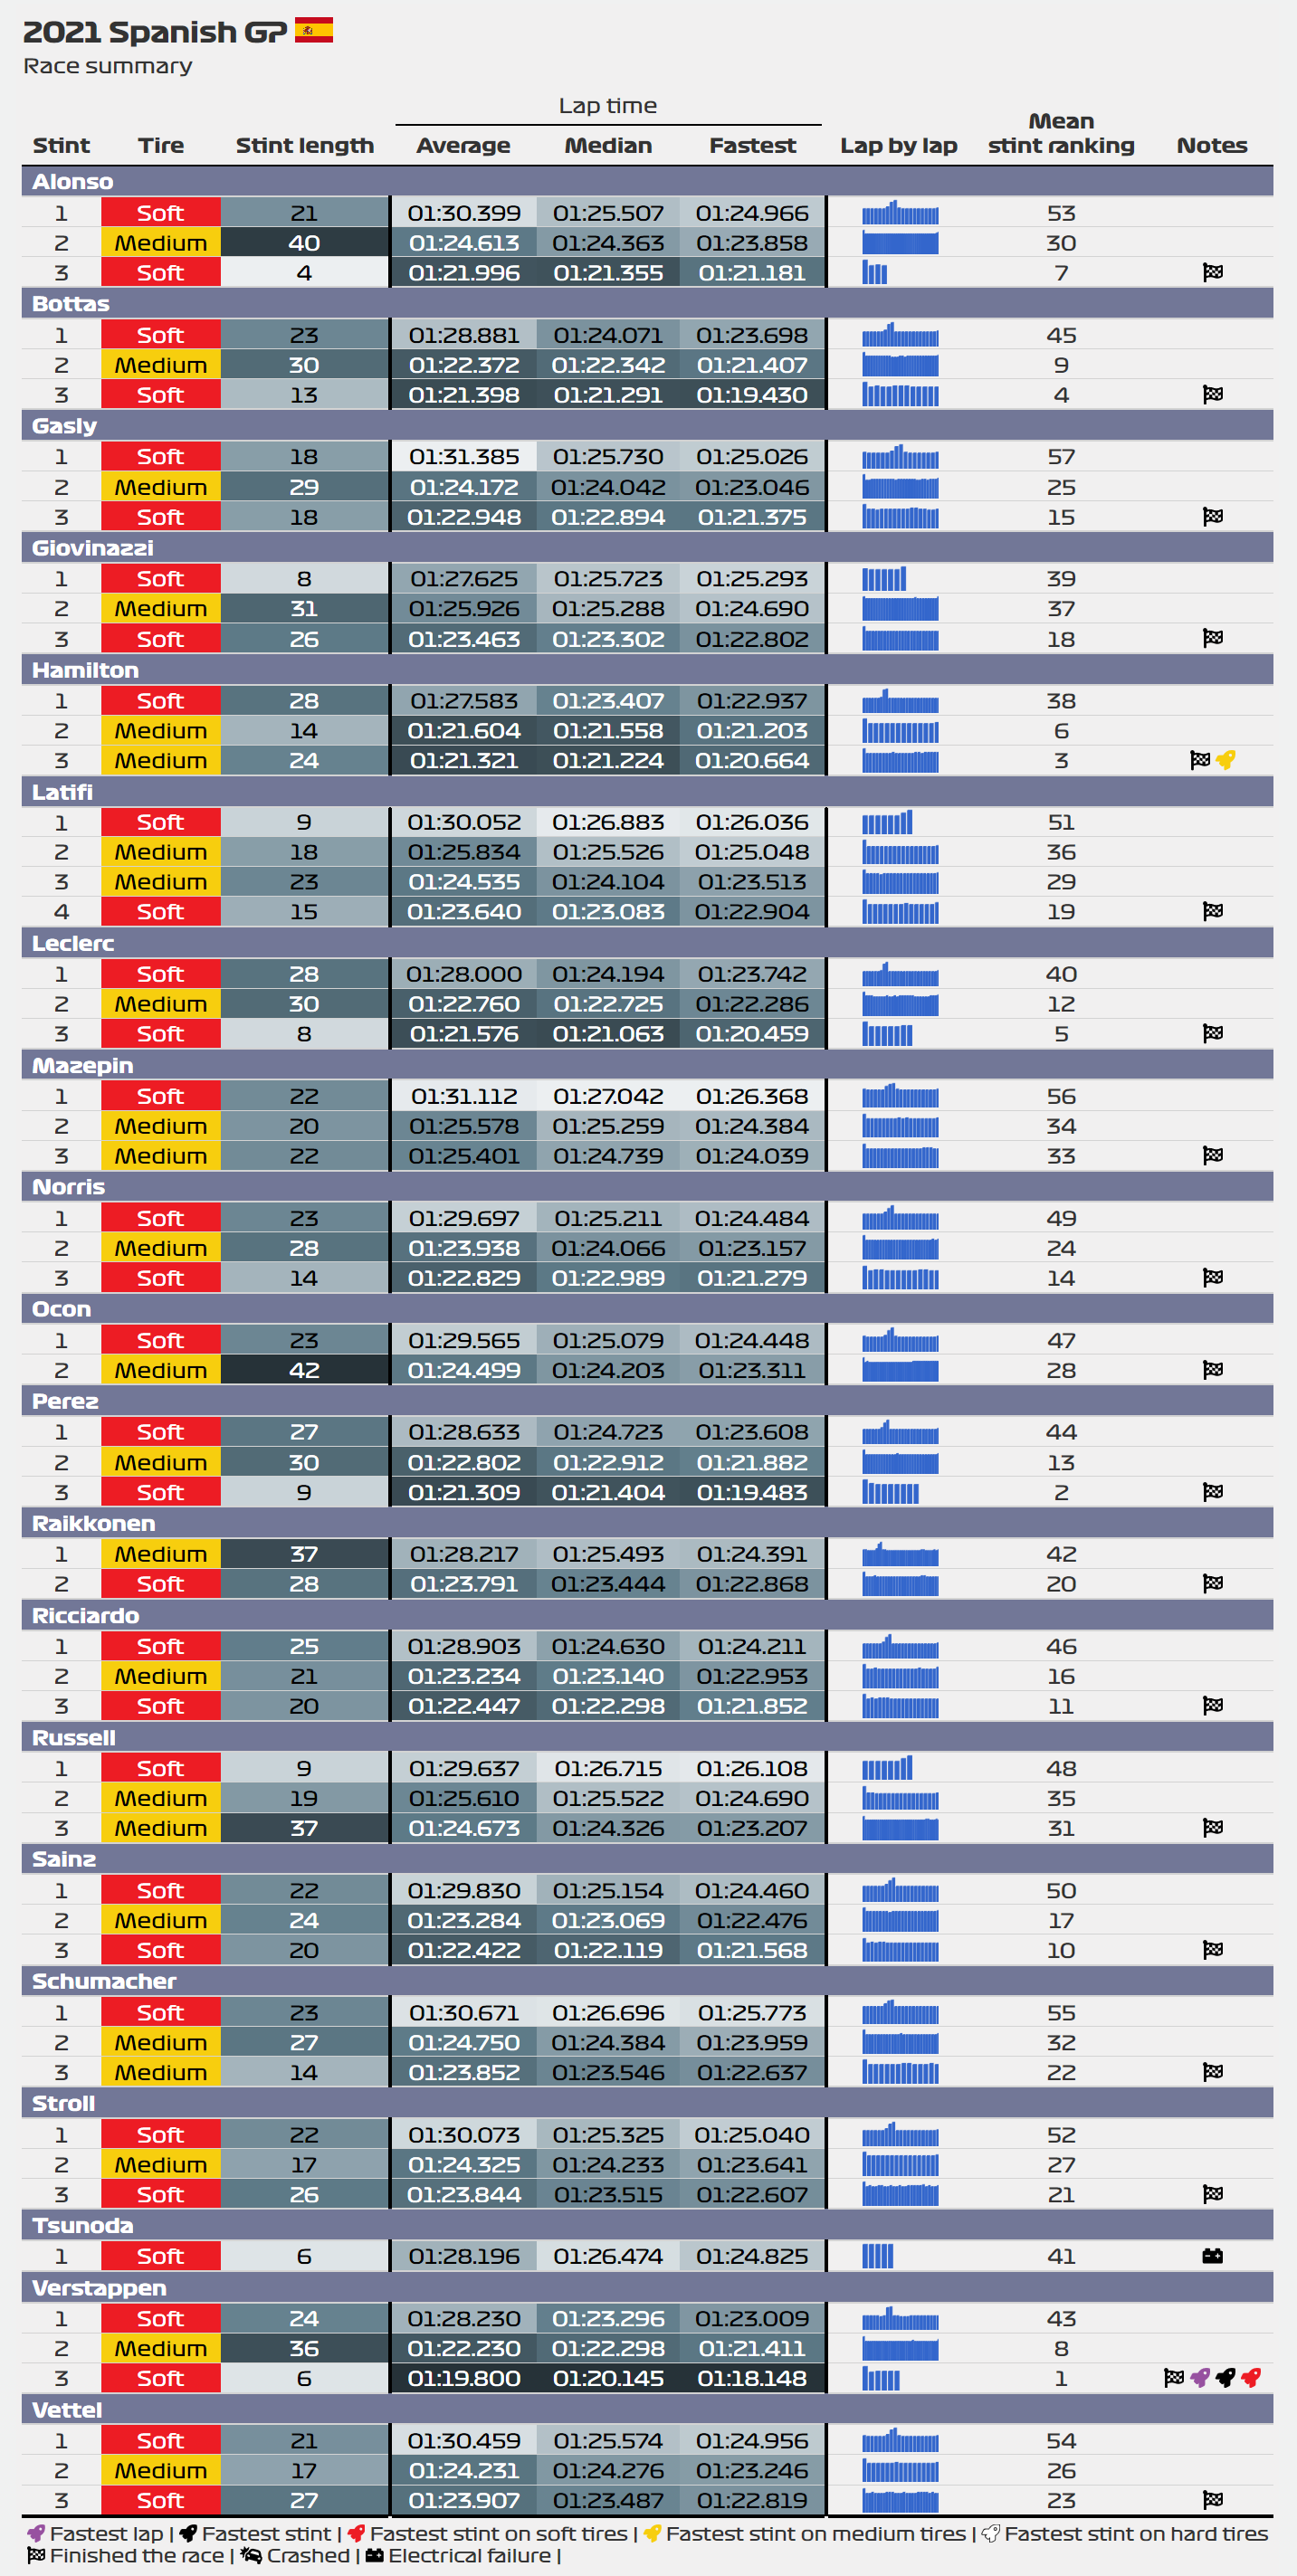
Race summary table
Another new addition! From now on, I will post this race summary table that shows most of the information you want to know about the race. Just to be clear, this table doesn’t consider the laps when the drivers went into the pits, but doesn’t remove the laps done under safety or virtual safety car conditions. Let me know what do you think about this chart so that I can keep improving.
If you want a hi-res image of this table just click here.
2021 Spanish GP  | ||||||||
|---|---|---|---|---|---|---|---|---|
| Race summary | ||||||||
| Stint | Tire | Stint length | Lap time | Lap by lap | Mean stint ranking | Notes | ||
| Average | Median | Fastest | ||||||
| Alonso | ||||||||
| 1 | Soft | 21 | 01:30.399 | 01:25.507 | 01:24.966 | 53 | ||
| 2 | Medium | 40 | 01:24.613 | 01:24.363 | 01:23.858 | 30 | ||
| 3 | Soft | 4 | 01:21.996 | 01:21.355 | 01:21.181 | 7 | ||
| Bottas | ||||||||
| 1 | Soft | 23 | 01:28.881 | 01:24.071 | 01:23.698 | 45 | ||
| 2 | Medium | 30 | 01:22.372 | 01:22.342 | 01:21.407 | 9 | ||
| 3 | Soft | 13 | 01:21.398 | 01:21.291 | 01:19.430 | 4 | ||
| Gasly | ||||||||
| 1 | Soft | 18 | 01:31.385 | 01:25.730 | 01:25.026 | 57 | ||
| 2 | Medium | 29 | 01:24.172 | 01:24.042 | 01:23.046 | 25 | ||
| 3 | Soft | 18 | 01:22.948 | 01:22.894 | 01:21.375 | 15 | ||
| Giovinazzi | ||||||||
| 1 | Soft | 8 | 01:27.625 | 01:25.723 | 01:25.293 | 39 | ||
| 2 | Medium | 31 | 01:25.926 | 01:25.288 | 01:24.690 | 37 | ||
| 3 | Soft | 26 | 01:23.463 | 01:23.302 | 01:22.802 | 18 | ||
| Hamilton | ||||||||
| 1 | Soft | 28 | 01:27.583 | 01:23.407 | 01:22.937 | 38 | ||
| 2 | Medium | 14 | 01:21.604 | 01:21.558 | 01:21.203 | 6 | ||
| 3 | Medium | 24 | 01:21.321 | 01:21.224 | 01:20.664 | 3 | ||
| Latifi | ||||||||
| 1 | Soft | 9 | 01:30.052 | 01:26.883 | 01:26.036 | 51 | ||
| 2 | Medium | 18 | 01:25.834 | 01:25.526 | 01:25.048 | 36 | ||
| 3 | Medium | 23 | 01:24.535 | 01:24.104 | 01:23.513 | 29 | ||
| 4 | Soft | 15 | 01:23.640 | 01:23.083 | 01:22.904 | 19 | ||
| Leclerc | ||||||||
| 1 | Soft | 28 | 01:28.000 | 01:24.194 | 01:23.742 | 40 | ||
| 2 | Medium | 30 | 01:22.760 | 01:22.725 | 01:22.286 | 12 | ||
| 3 | Soft | 8 | 01:21.576 | 01:21.063 | 01:20.459 | 5 | ||
| Mazepin | ||||||||
| 1 | Soft | 22 | 01:31.112 | 01:27.042 | 01:26.368 | 56 | ||
| 2 | Medium | 20 | 01:25.578 | 01:25.259 | 01:24.384 | 34 | ||
| 3 | Medium | 22 | 01:25.401 | 01:24.739 | 01:24.039 | 33 | ||
| Norris | ||||||||
| 1 | Soft | 23 | 01:29.697 | 01:25.211 | 01:24.484 | 49 | ||
| 2 | Medium | 28 | 01:23.938 | 01:24.066 | 01:23.157 | 24 | ||
| 3 | Soft | 14 | 01:22.829 | 01:22.989 | 01:21.279 | 14 | ||
| Ocon | ||||||||
| 1 | Soft | 23 | 01:29.565 | 01:25.079 | 01:24.448 | 47 | ||
| 2 | Medium | 42 | 01:24.499 | 01:24.203 | 01:23.311 | 28 | ||
| Perez | ||||||||
| 1 | Soft | 27 | 01:28.633 | 01:24.723 | 01:23.608 | 44 | ||
| 2 | Medium | 30 | 01:22.802 | 01:22.912 | 01:21.882 | 13 | ||
| 3 | Soft | 9 | 01:21.309 | 01:21.404 | 01:19.483 | 2 | ||
| Raikkonen | ||||||||
| 1 | Medium | 37 | 01:28.217 | 01:25.493 | 01:24.391 | 42 | ||
| 2 | Soft | 28 | 01:23.791 | 01:23.444 | 01:22.868 | 20 | ||
| Ricciardo | ||||||||
| 1 | Soft | 25 | 01:28.903 | 01:24.630 | 01:24.211 | 46 | ||
| 2 | Medium | 21 | 01:23.234 | 01:23.140 | 01:22.953 | 16 | ||
| 3 | Soft | 20 | 01:22.447 | 01:22.298 | 01:21.852 | 11 | ||
| Russell | ||||||||
| 1 | Soft | 9 | 01:29.637 | 01:26.715 | 01:26.108 | 48 | ||
| 2 | Medium | 19 | 01:25.610 | 01:25.522 | 01:24.690 | 35 | ||
| 3 | Medium | 37 | 01:24.673 | 01:24.326 | 01:23.207 | 31 | ||
| Sainz | ||||||||
| 1 | Soft | 22 | 01:29.830 | 01:25.154 | 01:24.460 | 50 | ||
| 2 | Medium | 24 | 01:23.284 | 01:23.069 | 01:22.476 | 17 | ||
| 3 | Soft | 20 | 01:22.422 | 01:22.119 | 01:21.568 | 10 | ||
| Schumacher | ||||||||
| 1 | Soft | 23 | 01:30.671 | 01:26.696 | 01:25.773 | 55 | ||
| 2 | Medium | 27 | 01:24.750 | 01:24.384 | 01:23.959 | 32 | ||
| 3 | Medium | 14 | 01:23.852 | 01:23.546 | 01:22.637 | 22 | ||
| Stroll | ||||||||
| 1 | Soft | 22 | 01:30.073 | 01:25.325 | 01:25.040 | 52 | ||
| 2 | Medium | 17 | 01:24.325 | 01:24.233 | 01:23.641 | 27 | ||
| 3 | Soft | 26 | 01:23.844 | 01:23.515 | 01:22.607 | 21 | ||
| Tsunoda | ||||||||
| 1 | Soft | 6 | 01:28.196 | 01:26.474 | 01:24.825 | 41 | ||
| Verstappen | ||||||||
| 1 | Soft | 24 | 01:28.230 | 01:23.296 | 01:23.009 | 43 | ||
| 2 | Medium | 36 | 01:22.230 | 01:22.298 | 01:21.411 | 8 | ||
| 3 | Soft | 6 | 01:19.800 | 01:20.145 | 01:18.148 | 1 | ||
| Vettel | ||||||||
| 1 | Soft | 21 | 01:30.459 | 01:25.574 | 01:24.956 | 54 | ||
| 2 | Medium | 17 | 01:24.231 | 01:24.276 | 01:23.246 | 26 | ||
| 3 | Soft | 27 | 01:23.907 | 01:23.487 | 01:22.819 | 23 | ||
| Fastest lap |
Fastest stint |
Fastest stint on soft tires |
Fastest stint on medium tires |
Fastest stint on hard tires Finished the race | Crashed | Electrical failure | | ||||||||
- Like
- Digg
- Del
- Tumblr
- VKontakte
- Buffer
- Love This
- Odnoklassniki
- Meneame
- Blogger
- Amazon
- Yahoo Mail
- Gmail
- AOL
- Newsvine
- HackerNews
- Evernote
- MySpace
- Mail.ru
- Viadeo
- Line
- Comments
- Yummly
- SMS
- Viber
- Telegram
- Subscribe
- Skype
- Facebook Messenger
- Kakao
- LiveJournal
- Yammer
- Edgar
- Fintel
- Mix
- Instapaper
- Copy Link
What does it mean to plot the lap time on either the right side or the left side of the box? E.g. Why are Hamilton’s times more closely bunched horizontally than others?
Hello!
The horizontal position doesn’t really mean anything. The lap times are shifted towards the right or left just to make sure that the points do not overlap.
Love this. Would it be possible to add some sorting options for the summary? Sorting by final position or grouping by team/engine/start tyre etc could give some additional insights.
Hello Matt
I think as a future improvement that would be a good idea. The package that I’m currently using unfortunately doesn’t support that functionality at the moment. Still, I’m looking at other options to create the final summary that will allow you to have more control over what is being displayed.
Thanks for the analysis.
Two comments:
1) I like the third plot – even though it’s all the same data, it’s nice to see all twenty drivers plotted on the same scale.
2) The race summary table is interesting so far – it helps show how the 1-stop strategy hurt Alpine given Ocon’s pace compared to the rest of the midfield that kept to a 2-stop (and Gasly who was flying at the end!)