Interactive graphs
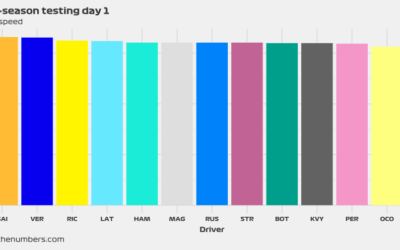
Pre-season testing – Top speed (days 1 to 3)
Pre-season testing is already here (yei!). While much is kept under secret, including engine modes and fuel loads, we can still get some interesting information from the data. Today, we will take a look at the maximum speeds seen during the first 3 days of testing.

2019 Singapore GP: FP2 – Top 5 by sector (Interactive)
Take a look at top 5 times per sector seen in FP2 at the 2019 Singapore GP.

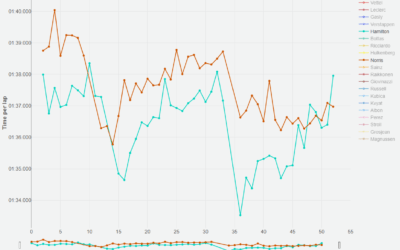
2019 Hungarian GP: Overall race for all drivers (Interactive)
Take a look at the interactive race plot for all drivers from the 2019 Hungarian GP.

2019 German GP: Race – Pit stops (interactive)
It is time to give the spotlight to the pit stop crew. The mechanics worked as they have never worked before, so let’s take a look at their performances during the last German Grand Prix.
2019 Bahrain GP: Interactive race history for all drivers
This time we get an interactive race history plot for all drivers that took part of the 2019 Bahrain GP.

2019 Bahrain GP: Interactive density plot for top 5 drivers
Come take a look at the interactive density plot for the top 5 drivers at the 2019 Bahrain GP.
Recent Comments